
Why 22% of First Shipments Fail QC (and How to Beat the Odds)
Why 22% of First Shipments Fail QC (and How to Beat the Odds)
Roughly one in five first shipments from a new China supplier is rejected at final inspection. QIMA's 2026 barometer data puts electronics and electrical orders outside AQL limits in 26% of cases for emerging-market buyers and 8% for developed-market buyers, while apparel first-pass failure was reported at 22% in Q1 2026. A first shipment fail inspection result is not bad luck. It is the predictable consequence of scaling a process that was only ever proven on one hand-made sample.
Where the First Shipment Fail Inspection Numbers Actually Come From
There is no official registry of failed shipments, which is why the figures quoted online vary so wildly. Every credible number comes from one of three places, and knowing which one you are reading changes how you should apply it.
- Third-party inspection bodies publishing aggregated results from their own booked jobs. QIMA's quarterly Supply Chain Barometer is the most-cited of these, drawing on its own product inspection and factory audit volume.
- Standards bodies defining what failure means. ISO 2859-1 fixes the sample sizes and accept-reject numbers, so a fail is a defined statistical event rather than an opinion.
- Practitioner books: agents and buying offices reporting their own reject rates. Useful for texture, but self-selected, because these are orders someone already thought were worth inspecting.
That third category matters more than people admit. Inspection statistics are drawn from inspected shipments, and buyers overwhelmingly inspect the orders they are already nervous about: new suppliers, new categories, first runs. So the headline failure rate overstates the risk on a fifth repeat order and probably understates it on an uninspected first one. Read it as a first-order number, which is exactly the decision this article is about.
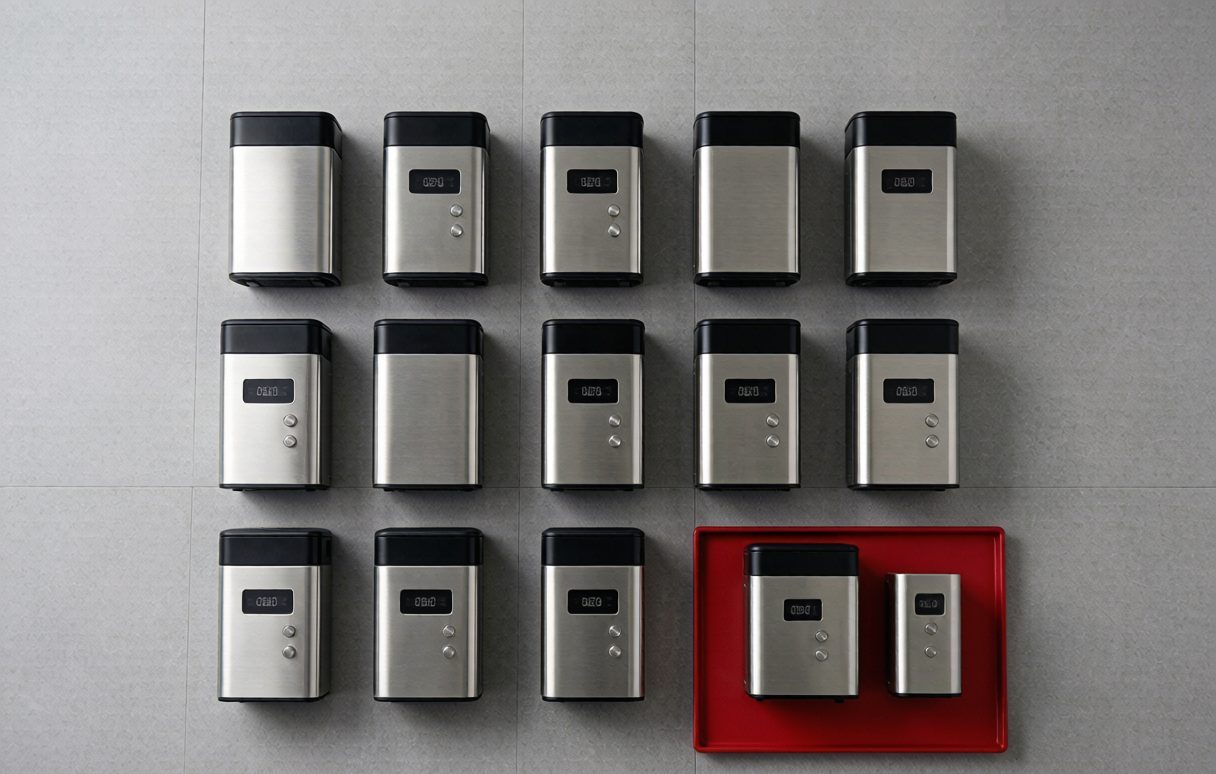
The 2026 Failure Rates, Category by Category
Failure risk is not uniform. It tracks component count, tooling dependency and safety regulation almost perfectly. The compiled first-pass figures below come from QIMA Q1 2026 barometer data for mainland China factories as circulated in trade coverage, and they line up with what we see across our own bookings.
| Category | First-pass failure rate, Q1 2026 | Dominant defect mode |
|---|---|---|
| Consumer electronics | 35% | Missing or wrong regulatory marks, wiring and solder faults |
| Children's toys | 31% | Small-part detachment, coating and material compliance |
| Silicone and plastics | 24% | Mould flash, surface contamination, colour shift between cavities |
| Apparel and textiles | 22% | Colour variance between dye lots, size mislabelling, stitch density |
| Furniture and home goods | 19% | Assembly tolerance, surface finish damage |
| Commodity and bulk goods | 11% | Short pack quantity, labelling errors |
The 22% in this article's title is the apparel and textiles line, and it is a useful anchor precisely because apparel is a mature, low-technology category. If a well-understood sewn product fails first-pass inspection more than one time in five, the 35% on electronics stops looking alarmist. Separately, QIMA's Q1 2026 audit data was reported to have found major defects in 28% of China factory audits, which is a different measurement of the same underlying fact: capability at the factory and conformity in the carton are not the same thing.
The most instructive single statistic in QIMA's Q3 2026 barometer is that gap. In electronics, 26% of emerging-market buyers' orders fell outside AQL against 8% for developed-market buyers; in homewares the split was 18% against 11%. QIMA's own reading is that this reflects buyer-side quality maturity rather than supplier performance. The same factories, producing for two different buyers, generate radically different failure rates. That is the whole argument of this article in one data point: the failure rate is substantially a function of what the buyer specifies and checks, not only of who makes the goods.
What a Fail Actually Means: Reading ISO 2859-1
A rejected shipment does not mean the goods are rubbish. It means the sampled defect count crossed a threshold you agreed to in advance. Under ISO 2859-1 at General Inspection Level II, a lot of 3,201 to 10,000 units draws a 200-piece sample; at AQL 2.5 for major defects, 10 majors accept the lot and 11 reject it. A lot of 1,201 to 3,200 units draws 125 pieces, accepting at 7 and rejecting at 8.
Two consequences follow, and both are routinely missed. First, the gap between passing and failing can be a single unit, which is why arguing with an inspector about one borderline defect is usually a waste of a day. Second, AQL is a risk window, not a guarantee: ISO 2859-1 sets the producer's risk at around 10%, meaning a lot sitting exactly at the agreed quality level still has roughly a one-in-ten chance of being rejected on sampling alone. Passing is not proof of a clean lot, and failing is not proof of a bad factory.
Set the level before the price, not after
Dropping from General Level II to Level I on a 1,000-unit order cuts the sample from 80 pieces to 32 and materially reduces your chance of detecting a 5% defect rate. If a quote for a pre-shipment check looks unusually cheap, confirm the inspection level before you compare it to anything.
Why the Second Order Still Fails
The intuitive model is that failure is a first-order problem which disappears once a supplier learns your standard. It flattens, but it does not disappear. Across our own Yiwu order book, roughly one repeat order in seven still comes back with a major-defect count over threshold, and that is a practitioner figure from our own records rather than a published statistic. The reasons are structural.
- Personnel turnover. The line leader who understood your tolerance on order one has often moved by order four, and tacit knowledge does not transfer with the job.
- Component substitution upstream. Your factory's own supplier changes a resin grade, a zip supplier or a coating batch without telling anyone, and nothing in your contract reaches that far up the chain.
- Volume growth. Order one at 2,000 units runs on one line. Order four at 20,000 units runs on two shifts and often a subcontracted workshop, which is a different process wearing the same name.
- Price erosion. Each renegotiation removes a little margin, and the margin is removed from somewhere physical: material thickness, plating time, thread count, packaging board weight.
- Complacency on the buyer's side. After two clean deliveries, buyers downgrade from a full inspection to a photo check, and the measured failure rate quietly stops being measured at all.
Why Production at Scale Drifts, and Why It Is Rarely Dishonesty
The golden sample you approved was almost certainly hand-finished by the factory's best operator, with unlimited time, from the best material on the shelf. It is a demonstration of capability, not a sample of output. Mass production is a different physical process, and the variance it introduces is normal manufacturing behaviour rather than deception.
Injection tooling illustrates it cleanly. A new mould runs tight for the first several thousand shots, then flash, sink marks and dimensional creep appear as the tool heats and wears; multi-cavity tools drift at different rates per cavity, so parts from cavity 1 and cavity 8 stop matching each other before either stops matching the drawing. Textile dyeing behaves the same way across lots. None of this requires anyone to act in bad faith, and that is precisely why relying on trust as a quality strategy fails on the statistics.

The Four Risk Zones: Predicting a Fail Before You Order
Failure probability is largely knowable in advance from four variables. Score your order on each and you can tell before production starts whether you are buying a green-zone item or an orange-zone one, and how much inspection budget it deserves.
| Risk zone | Order profile | Typical exposure | Inspection response |
|---|---|---|---|
| Green | Repeat SKU, repeat supplier, stock item, no customisation | Low, close to the 11% commodity band | Pre-shipment inspection at Level II, or a reduced check on stable lots |
| Yellow | New supplier, but a simple existing product with no tooling | Around the 19-22% range | Full pre-shipment inspection at Level II, sealed reference sample |
| Orange | Custom tooling, custom packaging, or first run of a multi-component item | Approaching the 31-35% bands | During-production check at 15-30% completion plus pre-shipment inspection |
| Red | Safety-regulated, certified, or first order at volume from an unvisited factory | Highest, and the cost of a fail extends to recall exposure | Factory audit, during-production check, pre-shipment inspection and loading supervision |
The single strongest predictor is not the country, the platform or the price. It is whether the product requires new tooling. Tooling degrades or shifts partway through a run rather than at the start, so a defect that a final inspection catches at 100% completion was frequently already fixable at 20% completion. Which specific inspection type suits each zone is a separate decision, covered in our inspection service notes rather than here.
How Inspection Changes the Odds, in Numbers
Inspection does not lower a factory's defect rate on its own. It relocates the discovery of the defect from your warehouse to theirs, which is where the entire economic argument sits. QIMA's own guidance puts the defect reduction from a regular pre-shipment inspection programme at 10-15%, achieved through the feedback loop rather than the single check, and estimates that apparel businesses lose 15-20% of revenue to quality failures when that loop is absent.
Compare the two paths on a 3,000-unit order. Path one: no inspection, defects discovered by customers, and you are paying return shipping, refunds, marketplace penalties and reputational damage on a product already sitting in a foreign warehouse. Path two: an inspection at $120-$400 per man-day, which is the 2026 market range for third-party work in China, finds the same defect while the goods are still under the factory's roof and while you still hold the final payment tranche. The defect count is identical. The leverage is completely different. This is also why a buyer with someone physically present in China tends to sit closer to the 8% developed-market band than the 26% figure in QIMA's data.
Inspection does not make a factory better. It moves the moment of discovery to the only point where you still have leverage.
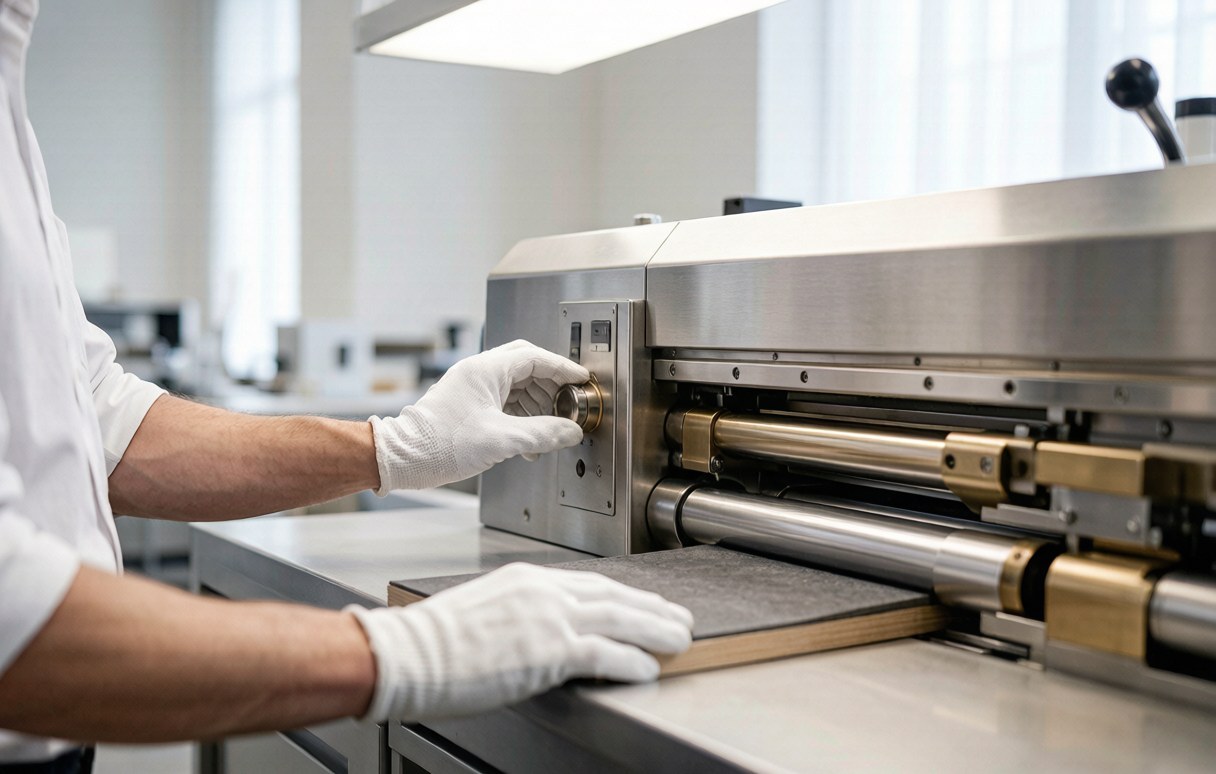
What the Statistics Look Like From a Yiwu QC Bench
Two things about these numbers only become obvious on the ground. The first is the shelf-sample problem. Much of what is sold through Yiwu International Trade City comes from small workshops in the surrounding counties, with Yongkang doing hardware, Dongyang doing wood and toys and Pujiang doing glass and crystal. The sample sitting on the booth shelf in District 1 is frequently the best unit of a previous run, kept because it photographs well. It is a marketing object. Approving it as your production reference is how a large share of first-order failures begin, and asking the booth to pull a unit from current stock instead costs nothing and changes the baseline.
The second is stacking order. In the consolidation warehouses around Yiwu, cartons from six or eight different booths arrive across a week and get stacked roughly to shoulder height on shared pallets, with the earliest arrivals at the bottom. Factories and booths both tend to present their best cartons on top. Our inspectors are instructed to open from the bottom and middle layers of a stack before touching the top, and the difference in what turns up is not subtle. Any inspection report that only shows top-layer cartons has told you very little. RND Sourcing applies the same rule whether the goods came from a booth or a factory.
Frequently Asked Questions About First-Shipment Inspection Failures
Is a 22% first-shipment failure rate normal?
Yes, for a new supplier on a moderately complex product. Reported Q1 2026 first-pass failure ran at 22% for apparel and textiles and 35% for consumer electronics, so a rejection on order one is a statistically ordinary event rather than a sign you picked a bad factory.
Does a failed inspection mean I should change supplier?
Usually not on its own. A fail means the sampled defect count crossed the AQL threshold, and most first-order fails are process-setup issues that rework fixes. Change supplier when the same defect recurs after rework, or when the factory disputes the defect classification rather than fixing it.
Why did my goods pass inspection and still arrive defective?
Because AQL is a sampling standard, not a 100% check. ISO 2859-1 sets the producer's risk at about 10%, so a lot sitting at the agreed quality level can still pass while containing defects. Sampling controls your average risk; it does not promise a perfect carton.
Does a first shipment fail inspection delay my whole order?
Typically by one to three weeks depending on the defect. Rework of a cosmetic or packaging fault is fast; anything requiring re-moulding or re-dyeing takes longer. Build a rework buffer into the first order rather than into the third.
Which single factor best predicts a failure?
Whether the product needs new tooling. Tooling shifts partway through a run, so custom-moulded first orders cluster in the highest failure bands while repeat stock items sit near the 11% commodity level.
The 22% is not a warning about China. It is a description of what happens when a hand-finished sample becomes twenty thousand machine-made units, and it is the reason experienced importers treat inspection as a line item rather than a contingency. If you want a candid read on which risk zone your next order sits in, send the specification and quantity through our inquiry form and we will tell you where we would put the checks. More of our field data is published at yourchinagent.com.


